Microsoft 365 Business Central offers powerful reporting tools that help you visualise several project factors in a variety of views.
The screenshot below is a factbox which summarises key values of a job. In the Hour Breakdown section, the system compares the budgeted hours with the actual hours.
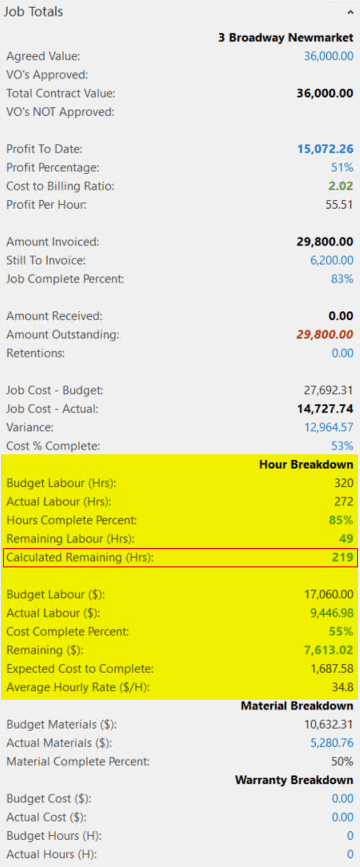
The system calculates the Hours Complete % and Remaining Labour (Hours) though there is a risk of misinterpretation – giving a wrong impression of the actual job’s situation.
As an alternative, you can look at labour from a value perspective instead of a number of hours.
When done for the example below, we see that the total budget in $ for labour is 17,060.00 NZD (= 320H @ 53.3125 $/H).
We have currently spent 272H with a total cost of 9,446.98 NZD, meanings that the average cost per hour is 34.8 $/H.
By comparing the remaining labour budget of 7,613.02 NZD ($17.060 – $9,446.98) based on the calculated average of 34.8 $/H, we still have 219H remaining instead of the 49H based on the original 53.3125$/H. This shows that comparing actuals vs budgets on unit level can be misleading.
By adding junior or intermediate people instead of all senior level people to the project team, the remaining number of hours can be significantly manipulated.
Sales reporting within Construction Contracts Act environment
The Construction Contracts Act provides a process for dealing with payments and disputes.
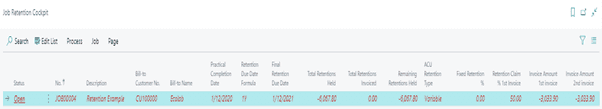
The Retention Cockpit gives an overview of all jobs for which retentions are currently held and how much.
It also serves as a management tool which will alert WAL when Retention Claims are due, and how much can be claimed back as part of the first claim.
This functionality has been described in the Claim Progress Payment section.
Variance Reporting
Variance reporting will compare budget with actuals.
These reports are only accurate once the job is completed and all costs have been posted to the job, meaning that there is no chance of rectifying the problem if the actual costs exceed budgeted costs. The lessons learned can only be applied to future jobs.
To predict the final result during the course of the project, it would be possible to anticipate overruns and mitigate where possible. The only way to provide this information is by calculating the % of completion and/or estimate to complete as accurately as possible, as often as possible.
As a rule of thumb, the ideal timing for this is when the Progress Claims are created and processed. At that moment, all active jobs are evaluated for billing purposes, this might also be a good time to define the % of complete or estimate to complete for the breakdown of the job.
Microsoft 365 Business Central allows Project Managers to fill in this information on the Progress Claim. The system will then copy these values to the correct places.
Variance Reporting can be found throughout the system, on the screen or via reporting.
The above described factbox shows the difference between budget and actual, broken down for Hours and Materials.
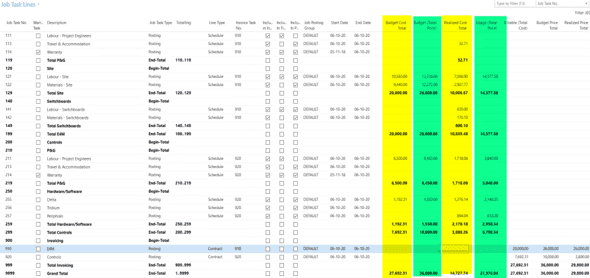
The below screenshot is an example of WBS. The Budgeted and Actual Cost values are shown as well as the sales value (budget value vs invoiced price).
General ledger and category code reporting
365 Business Central has Item Categories as Standard and also allows Customers, Vendors, Items and Jobs to be set up with different Posting Groups for G/L Analysis. The Analysis by Dimension Reports also report by these Groupings.
Financial reports can be shown by Posting Groups. Posting Groups determine the posting of entries to the ledger.
Cost Reporting
Analysis reports for Inventory, Sales and Purchase all show COGs reporting as an option for the user to select when building the report.
Cost Reporting on Jobs
Job Cost reports come in different shapes and colors. Depending on the requirements, it can be a detailed list of all cost posted to job. Other reporting might be more summarised based on the milestones, WBS, Material/Labour/Other category.
The reports can be printed for a specific job, or a set of jobs where relevant.
Project site reporting e.g. installation process
These reports calculate the % of completion of a specific Milestone or task. They are company specific and 365 Business Central provide the tools and the data to be able to build them.
This reporting is quite often displayed on the screen rather than a printed document.
The information should be available and accurate at any point in time and include the latest information.
Power BI and other reporting tools can also provide Dashboard pages which display this information.